When evaluating commercial and industrial (C&I) energy efficiency programs, it often seems like the most extensive and complicated projects (those most likely to be adjusted during our review) come in at the end of the year. Is that the case, or is that just selective memory? I wasn’t sure, so I decided to investigate.
Making Waves
Evaluations of C&I programs are often conducted in waves for several reasons. First, they provide more “real-time” feedback to program implementers to make changes to the program as quickly as possible. Segmenting projects into waves also spreads the evaluation work over a more extended period of time.
However, cumulative savings of C&I programs often follow a hockey stick curve, with the largest share of savings installed towards the end of the program year. The number of completed projects and their average size tend to increase as both program administrators and participants try to make year-end goals before the end of the year.
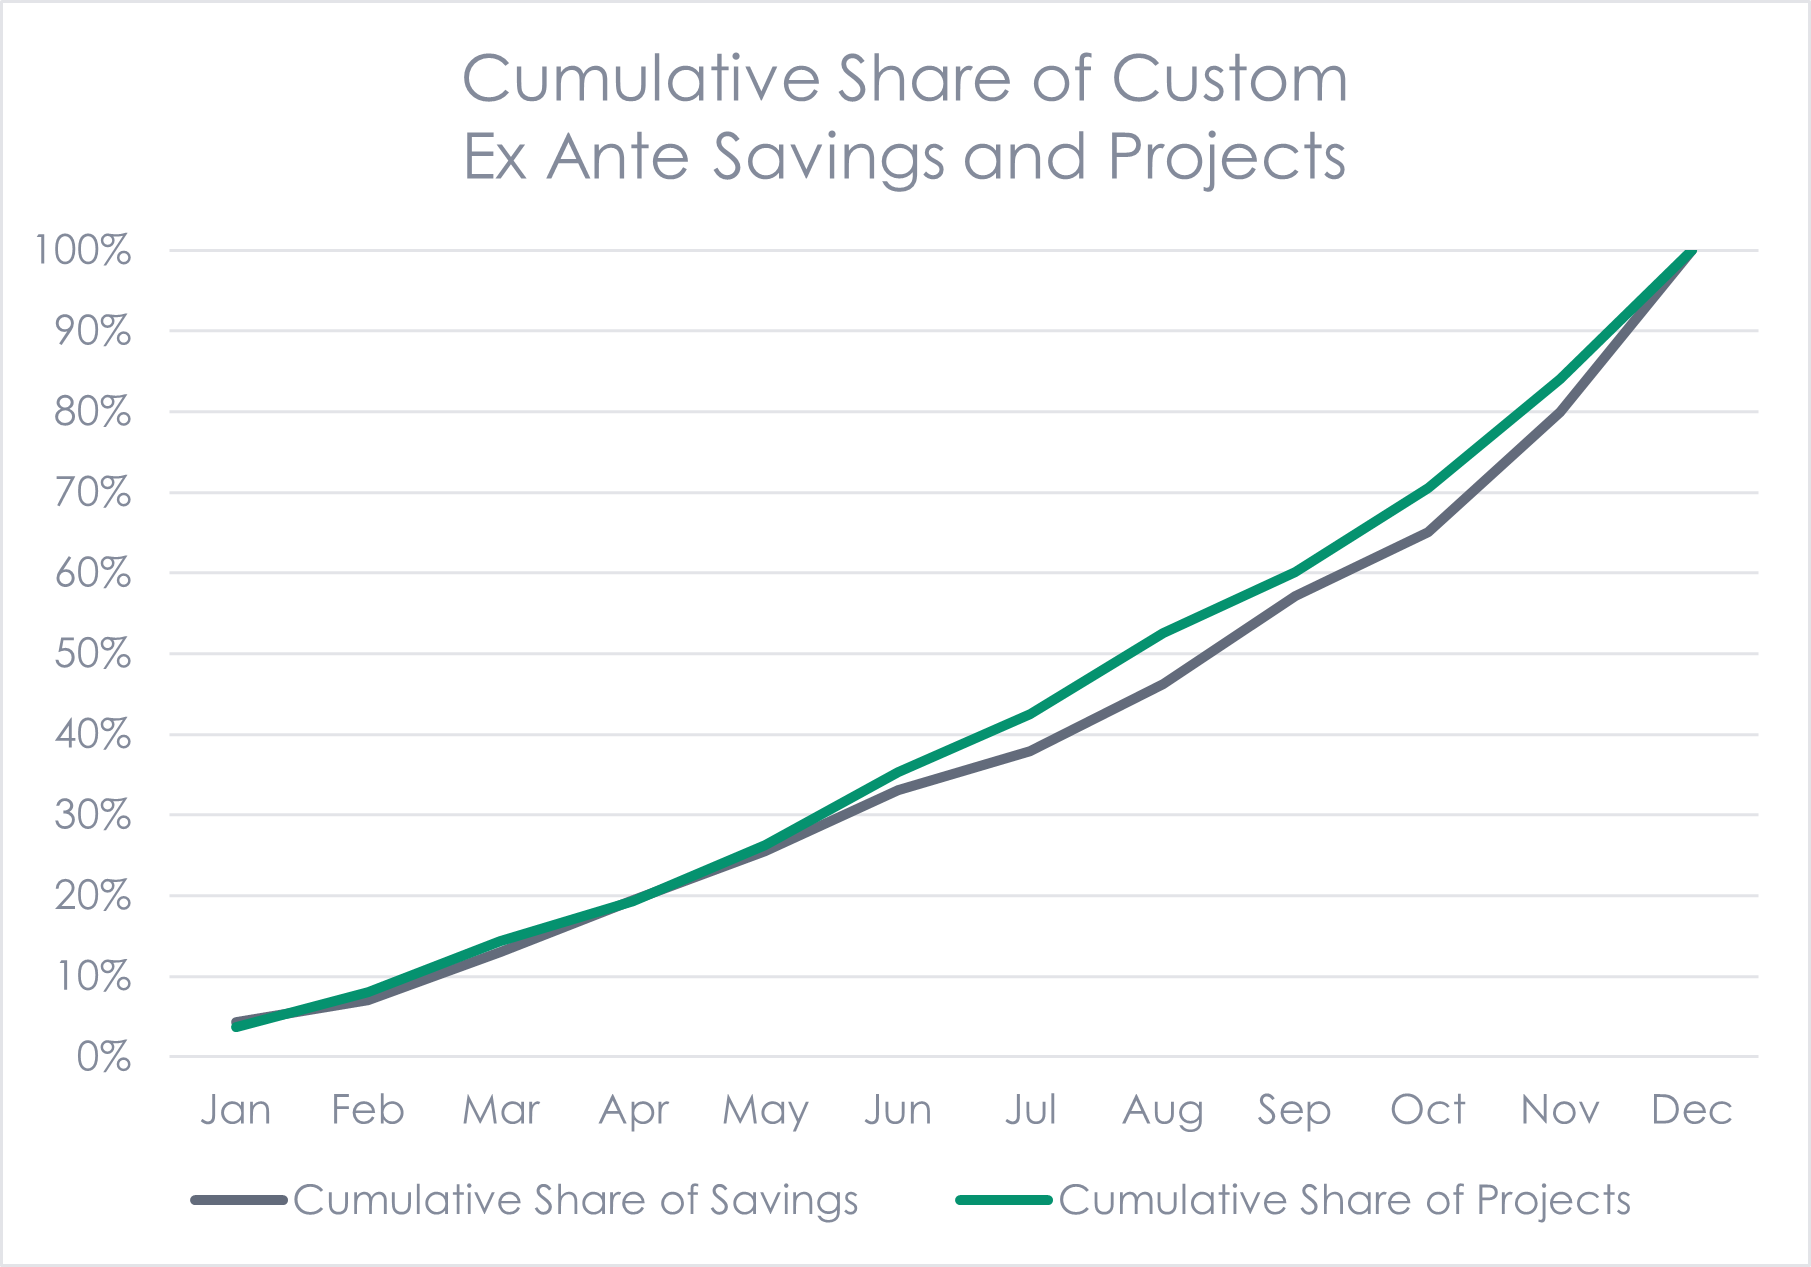
The figure below shows an example of the cumulative share of projects and savings by month for several years of a custom C&I program Michaels evaluated. While not quite a hockey stick, it is clear that the share of both projects and savings increase as the year progresses. Additionally, the average size of the projects increases over the last quarter. 
If evaluators want to look at the entire program year, then some of the projects installed at the end of the year (e.g., in December in a program that runs on a calendar year cycle) need to be reviewed after the program year closes. Some jurisdictions have evaluation reporting requirements that require the evaluation to be completed a short time after the program year ends. In these cases, both implementers and evaluators have to move very quickly to account for these end-of-the-year projects. In the case of custom C&I programs, where end-of-the-year projects are larger and more common, this presents additional challenges.
Differences in Realization Rates
So we can see a difference in the number and size of projects participating in custom C&I programs over the course of a year, but is there a difference in realization rates over time?
As a refresher, the realization rate is the evaluated (ex-post) gross savings divided by the claimed (ex-ante) gross savings. A value may not equal 100% because the evaluator made adjustments for data errors, differences in measure types or counts, differences in baseline assumptions, and many other reasons.
Before looking into the differences in realization rates over time, let’s explore why end-of-the-year projects might have different realization rates than earlier projects.
- Quick calculations: In an effort to complete a project before the end of the program year, the customer, contractor, or implementer may be less rigorous in their energy savings calculations than at other times of the year. This may result in a higher likelihood of adjustments by the evaluator.
- Lack of supporting details: With a short turnaround between the end of the program year and evaluation reporting timeline requirements, it may not be possible for the implementer or customer to provide supporting documents or data to the evaluator in time to verify project specifics. This is especially true if this information needs to be gathered from a contractor or the customer. Absent these supporting details, the evaluator may need to make assumptions about the project or else rely on incomplete project information.
- Limited post-installation billing data: For projects with savings estimated through a billing analysis, having only a short period of billing data after the project was completed may limit the usability or accuracy of the estimate. This is especially true for weather-dependent projects where longer periods of data are required to account for seasonal differences.
Comparison of Waves
So we can see a difference in the number and size of projects participating in custom C&I programs over the course of a year, but is there a difference in realization rates over time?
To investigate this question, we looked at three years of results for a custom C&I program. For this program, the impact evaluation typically divides the program year into three waves, each consisting of approximately 3-4 months.
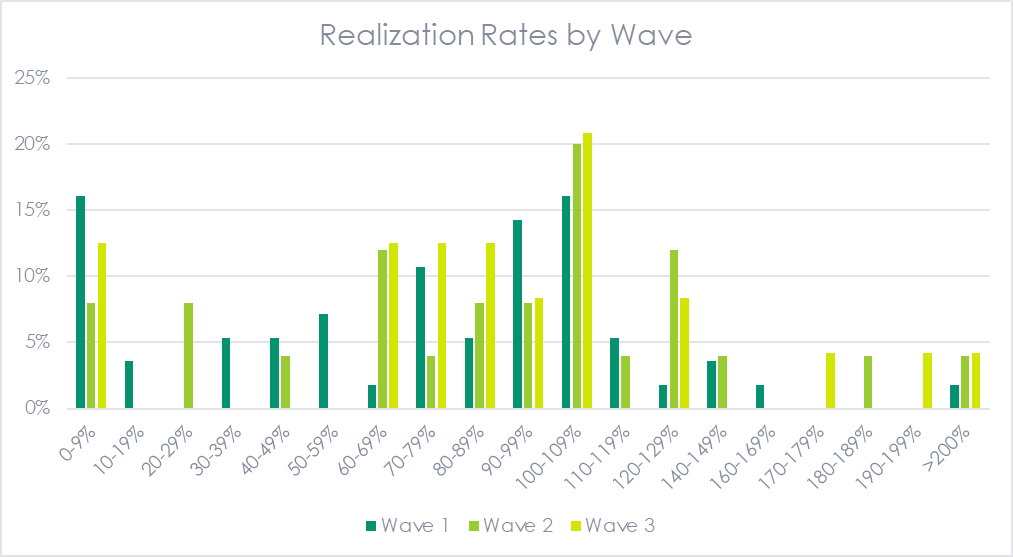
The figure below shows the realization rates for projects by wave. At first glance, it is hard to make a clear conclusion. it appears that projects completed earlier in the year (Wave 1) are less likely to have a 100% realization rate and are more likely to have under 50%. Wave 3 projects are much more likely to have a realization rate of between 50 and 100. More than 20% of Wave 2 and Wave 3 projects had realization rates of over 120%. The largest share of projects with a 100% realization rate was in Wave 3, potentially due to the lack of supporting details for some projects.
One other dimension to consider is the size of the project.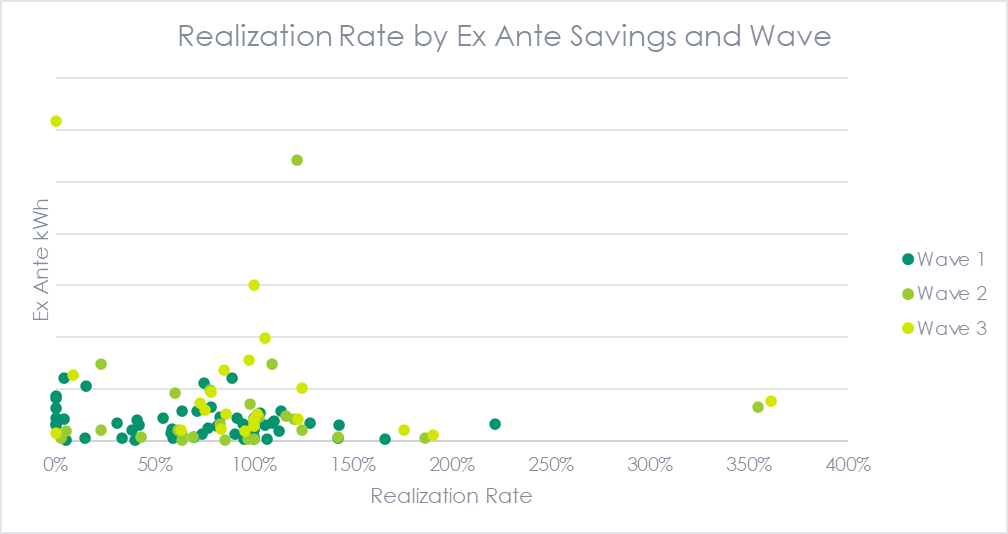 Lastly, we looked at the variation in realization rate. The table below shows the mean, average weighted by savings, and standard deviation for each wave. Please note that this is just an average of the sampled projects and is not weighted back to the population. In other words, this is for illustrative purposes and is not representative of the program’s overall realization rate.
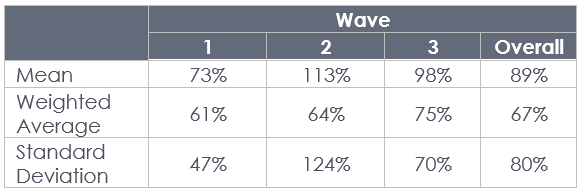
In the table, we can see that the standard deviation (the average distance from the mean) is lowest for the first part of the year and much higher in the later part of the year. This indicates that there were likely more adjustments in Waves 2 and 3.
Takeaways
In this cursory review, it appears that projects completed later in the year have some differences from those completed earlier. This could be caused by a number of issues. Unfortunately, there is not a clear picture of in which direction the adjustments typically occur. In some cases, a lack of project detail for end-of-the-year projects may even result in a higher share of 100%. For projects requiring long periods of post-installation data, evaluators may consider if there are ways to pull the evaluation of those projects into the next evaluation cycle, perhaps by developing an initial realization rate for reporting and then truing it up in the next year.