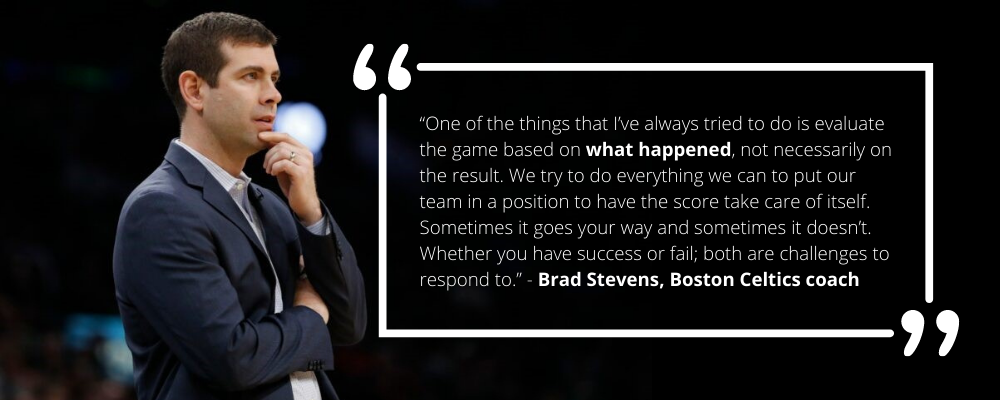
I am a big fan of the Boston Celtics and their coach, Brad Stevens. How does this relate to sampling error in cost-effectiveness testing? Read on and let’s see if I can stick the landing.

Original image credit: nba.com
I have always liked Brad Stevens’ mentality that you shouldn’t get too caught up in the results of a close game if it came down to making or missing a last minute shot. The same issues that got the team into that close situation still need to be addressed whether the game ends with a one point win or a one point loss.
When preparing a presentation for the upcoming AESP annual conference about the sensitivity of inputs to cost-effectiveness, we found that cost-effectiveness tests appear to be fairly sensitive to kWh savings. Should programs and regulators consider this for measures or programs that are on the threshold of being cost-effective? Could the difference between passing and failing a benefit/cost test come down to sampling error (analogous to a game-winning buzzer-beater)?
Nearly all impact evaluations include some element of sampling to assess the total savings of a program. We do this because directly assessing the savings for each installed measure or participant would be cost-prohibitive or impractical. What this means, though, is that the reported result (e.g., the mean) is influenced by the particular sample selected which likely will not exactly match the mean of the population or the mean of another sample due to randomness. The difference between the estimate and the true value is called the sampling error.
Impact evaluations are often required to meet stipulated confidence and precision targets. In our industry, this target is typically 90/10 confidence/relative precision. In other words, assuming a normal distribution, there is a 90% probability that the true value falls between 10% above or below the estimate. The +/- 10% is the estimate’s confidence interval.
To understand how sampling error of savings estimates might affect cost-effectiveness, we created a simplified example. We considered a measure with annual energy savings of 124 kWh and demand savings of 0.014 kW and assumed that it met the 90/10 threshold based on a sample of 40 observations. Using realistic inputs from actual programs, we calculated a total resource cost (TRC) value of 1.11 for this measure.
Using a Monte Carlo analysis, we ran 5,000 simulations of the total resource cost (TRC) test, randomly varying the kWh and kW values within a normal distribution. The chart below shows the results.
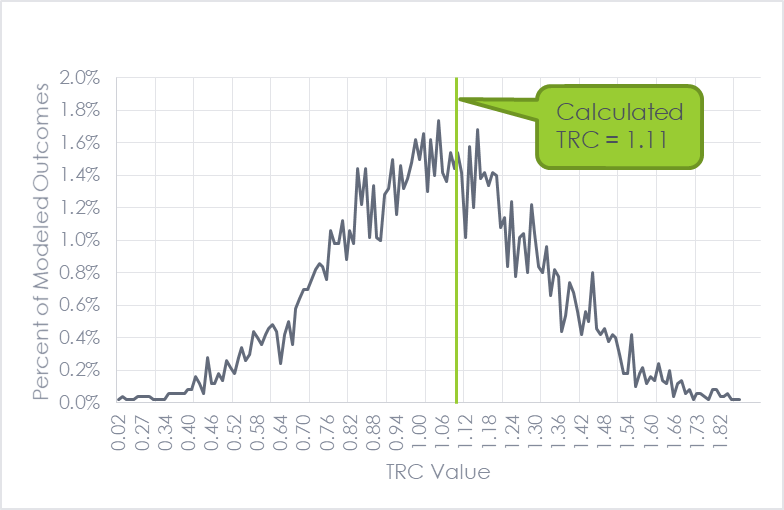
The first thing that jumps out is that the output is the shape of a normal distribution. Most of the model runs are near the calculated value of 1.11, but they range from 0.02 to 2.10! Notably, 57% of the model runs were cost-effective (TRC of 1.0 or greater), but 43% were not. This means that, in this example, if you estimated savings based on two different random samples, it would essentially be a coin flip (or roughly the probability of Shaquille O’Neal making a free throw) as to whether the measure would be cost-effective or not.
This is a simplified example to illustrate the concept. It is worth mentioning two important caveats: first, the scenarios at the extreme ends of the curve are very unlikely and also hopefully would not occur with a competent evaluator noticing that the results were way outside of what would be expected for that measure. Second, in this example, the kWh and kW values were treated as independent. In practice, they are linked and would move in the same direction, resulting in less variability in the TRC results.
Bringing it back to Brad Stevens’ coaching philosophy, this exercise shows that there could be no meaningful difference between a program or measure that does not pass a cost-effectiveness screen with a TRC of 0.99 and one that passes with a TRC of 1.01. Just like a basketball game may come down to a lucky shot as time expires, the makeup of a randomly selected sample may tilt the scales for a program in one direction or another. But if that is the case, what does it mean? First, it means that a marginally cost-effective program likely has opportunities to improve its implementation and these should be identified and explored. It also means that if a program or measure does not pass a cost-effectiveness screening but stakeholders believe that it is valuable and should still be offered, then perhaps the cost-effectiveness test should be re-examined. Cost-effectiveness frameworks should align with the priorities of the jurisdiction so that resources are allocated to the programs and measures which bring the most value, putting them in a position to have the score take care of itself.