
I love explaining things with diagrams. One thing I have really missed working from home over the past year is not being able to illustrate ideas on a whiteboard in discussions with colleagues[1]. Over the past month, there have been several instances where I needed to think about how to account for double counting in an evaluation, and drawing a picture was the best way to wrap my mind around the problem. This post covers some examples of potential double-counting common to energy efficiency evaluation and how to avoid them. Enjoy the pictures.

Multiple Measure Interactions
One common source of double counting is not properly accounting for the interaction of multiple measures. Simple examples of this are the installation of efficient lighting and occupancy sensors or an efficient heating or cooling system and a programmable thermostat. In these examples, one measure (e.g., the efficient lighting) uses less electricity than the baseline equipment while the other reduces the amount of time it is used, as illustrated in the figure below.
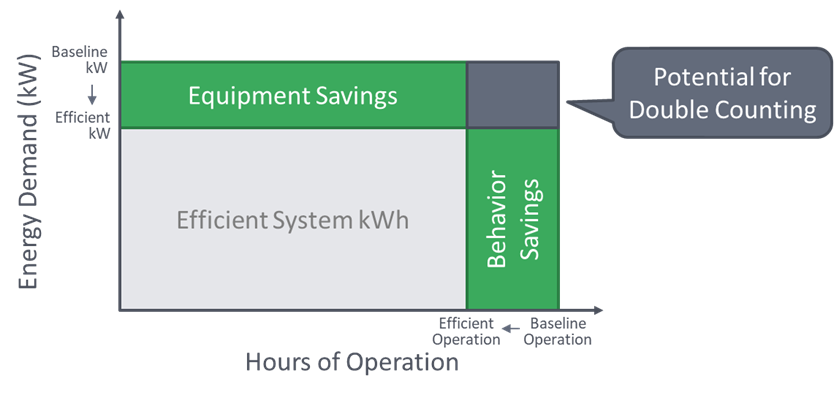
In this figure, the total area represents the total kWh of the baseline system (equipment and controls). The installation of efficient equipment lowers the amount of electricity used from “baseline kW” to “efficient kW,” while the installation of new controls drops the hours of operation from “baseline operation” to “efficient operation.” The area of the interior light grey rectangle represents the total kWh of the new efficient system.
So far so good. But, if we wanted to count the savings of each measure, we would need to be careful not to double count savings. We would need to account for one measure’s savings (like the efficient equipment) first, then apply the reduced hours of use to that. Otherwise, the dark grey rectangle in the figure would be counted twice – once for each measure separately.
Similarly, whole building measures like EMS or home energy reports may overstate savings if they do not properly account for savings from other measures (like an efficient HVAC system) installed at the same time.
Lifetime Savings
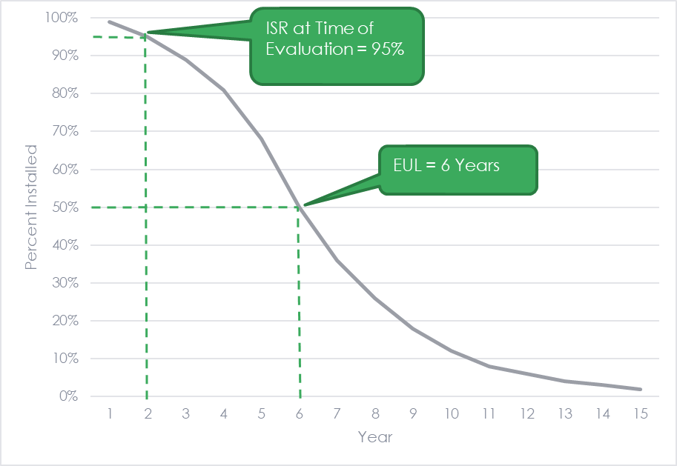
As lifetime savings become increasingly important to portfolios, so do assumptions about how long measures last. Evaluators must take care not to double penalize programs through in-service rate adjustments and measure life research. Often, evaluators include in-service or installation rate adjustments in their ex-post gross savings calculations to account for the measures that were not installed, were removed, or otherwise not persisting for whatever reason. Lifetime savings estimates multiply the first-year savings of the measure by its effective useful life (EUL)[2]. A measure’s EUL can come from a variety of dubious sources and mysterious assumptions, but the best estimates come from measure life studies that develop a statistical model (survival analysis) to estimate when measures fail.
Lifetime savings may be undercounted if the EUL is applied to ex-post savings that already account for some failures that have occurred between the measure installation and the evaluation. For most programs and measures, this issue is largely theoretical due to the small in-service rate adjustments and the blunt nature of EUL assumptions. However, this issue could be especially pronounced for measures with relatively short useful lives and high rates of early failure or discontinuation, such as operation & maintenance measures like retro-commissioning.
Spillover
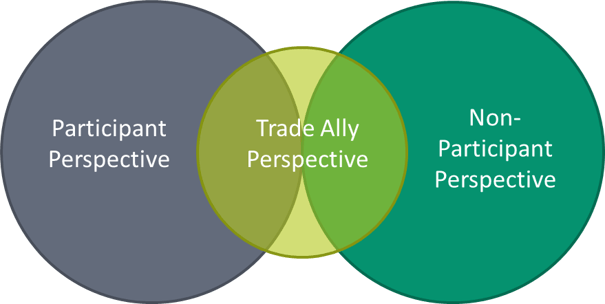
Spillover research also presents a risk for double counting. If spillover is assessed through both end-user research (i.e., participants and non-participants) and trade ally research, there is the potential for overlap, as shown in the Venn diagram below. If both categories of research are conducted in the same evaluation period, evaluators must ensure there is no double-counting of spillover savings. One way to do this is to ask end-users about the installer of the equipment resulting in spillover savings and cross-checking that trade ally with the sample used in the trade ally research. If that trade ally appears in the sample, the savings identified by the end-user should be removed from the analysis.
Cost Effectiveness
Finally, evaluators must take care not to double count benefits or costs in cost-effectiveness analyses. This is a key principle of the National Standard Practice Manual. Double-counting can surface in two ways: 1) double counting overlapping costs when they should be treated incrementally and 2) including costs that are captured in the benefits or vice versa.
Some examples of potential double-counting in cost-effectiveness analyses include:
- Including both bill savings and utility system benefits
- Including impacts of risk, reliability, and resilience to the utility, customer, and society independently
- Including both customer health benefits and societal environmental avoided costs
- Including both the cost of compliance for environmental regulations like RGGI and societal environmental costs
Evaluators should recognize the potential for overlap between these and other impacts and account for them accordingly.
[1] On the flip side, having a whiteboard in my home office means I get to see a lot more random artwork from my kids.
[2] Effective Useful Life is the median number of years that measures are still in place and operable.
Want more evaluation content? Check out our full blog here.