
Recently, I saw news of a study from USC that found the relatively low level of adoption of electric vehicles in California was already resulting in improved air quality and health outcomes. Based on real-world data, the study found that for every 20 EVs added to a community per 1,000 people, there was a 3.2% decrease in asthma-related emergency room visits. This is very interesting because while the non-energy benefits of decarbonization have always been recognized, the impacts are almost always quantified through models rather than observed data. But that made me wonder – how are the non-energy impacts of energy efficiency and demand flexibility usually estimated, and are those estimates any good?
The EV Study
First, a quick recap of the USC study. Researchers there related the change in the annual number of zero-emissions vehicles (including battery electric, plug-in hybrid, and hydrogen fuel cell vehicles) from 2013 to 2019 at the ZIP code level to annual average monitored nitrogen dioxide (NO2) concentrations[1] and annual age-adjusted asthma-related emergency room visits.
The study found that as EV penetration grew from 1.4 to 14.7 per 1,000 people over the study period, the concentration of NO2 dropped, as well as the number of asthma-related visits to the emergency room. Interestingly, the researchers found that the adoption of EVs and the related air quality and health improvements were greater in communities with higher educational attainment. This suggests that the co-benefits of EV adoption are not distributed equitably and are lowest in areas that probably already have higher levels of air pollution.
Quantifying Non-Energy Impacts
Non-energy impacts (NEIs) are additional impacts of demand-side management beyond the energy savings from implementing the energy efficiency measure. These are often called non-energy benefits (NEBs) because they are almost often net benefits, but the impacts can be either positive or negative. The NEIs of demand side management can come in the form of utility system impacts (e.g., improved reliability, decreased risk, increased resilience, etc.), participant impacts (e.g., productivity, safety, comfort), and societal (e.g., air quality, energy security, economic development, health). NEIs can be measured in different ways, including through direct measurement (e.g., utility data), secondary calculations (e.g., financial calculations), modeling (e.g., jobs and emissions), and surveys. In most cases, another step is required to monetize the measurement to include it in a cost-effectiveness analysis. Sometimes it is fairly easy to quantify and monetize NEIs, especially for participant-level impacts like increased productivity or reduction in heating assistance needed, but can be much harder for societal NEIs like improved public health outcomes.
Before any non-energy impacts can be attributed to a demand-side management measure, we must first confirm that implementing the measure results in the impacts and there is a documented relationship. This can be illustrated similarly to a program theory/logic model. The example below shows the potential pathways for respiratory effects following long-term exposure to fine particulate matter (PM2.5) from emissions.
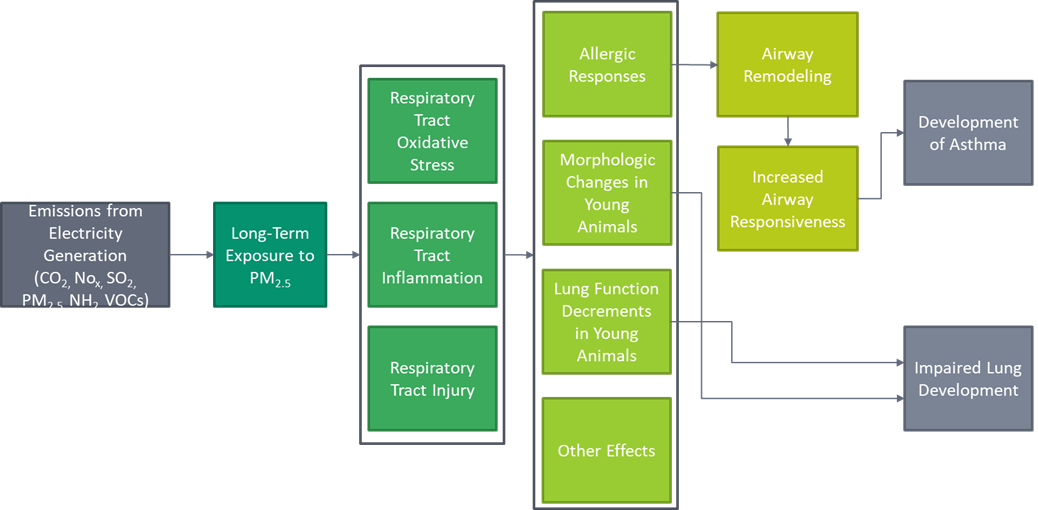
Adapted from Estimating PM2.5- and Ozone-Attributable Health Benefits, Figure 5.
Estimating Public Health Benefits
How can we estimate the public health impacts of an energy efficiency program if there is no readily available study like the USC EV study? Researchers often use the EPA’s Avoided Emissions and Generation Tool (AVERT) and the CO-Benefits Risk Assessment (COBRA) tools to estimate the air quality and health benefits of saving energy. AVERT calculates the avoided emissions of energy efficiency and renewable energy while COBRA estimates county-level health impacts from changes in air pollutants (CO2, PM2.5, SO2, NOx, NH3, and VOCs) and monetizes the economic value of those benefits.[2]
To test it out, I created a simple scenario in which my state of Massachusetts[3] reduces electric generation by 5% in all hours. AVERT calculates that this will displace 1,187 GWh of regional fossil fuel generation annually. This translates to an annual reduction of 234,220 tons of CO2, 62,620 pounds of NOx, and 6,450 pounds of PM2.5 in Massachusetts. The model shows annual regional displacements, including total emissions from fossil generation fleet and AVERT-derived emission rates (average and marginal), and state annual and monthly emission change.
Once we have the emissions data, it can be exported into the COBRA tool, which shows the health effects at the state and county level. COBRA shows the change in annual cases for 12 different outcomes (e.g., mortality, nonfatal heart attacks, emergency room visits for asthma, work loss days, etc.) and the monetary value associated with those outcomes. The results are based on statistical relationships in the change of particulate matter levels and health outcomes.
For this exercise, reducing generation by 5% in Massachusetts is estimated to reduce visits to the emergency room by 0.3 per year, reduce premature mortality by about 0.5 to 1.1 people per year, and prevent about 59 work loss days.[4] The total monetary value of these reductions is estimated to be about $5.5 to $12.5 million per year.
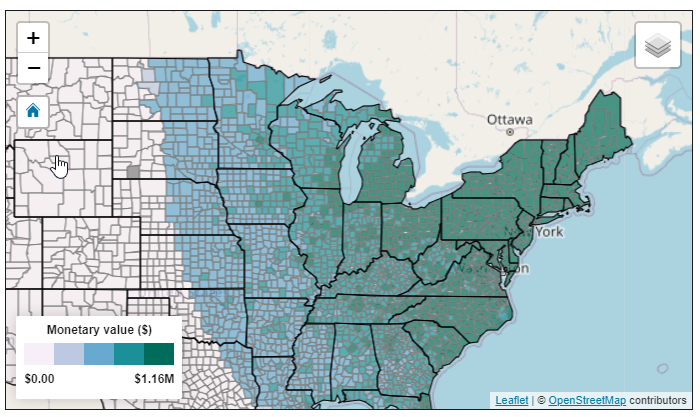
COBRA accounts for the fact that pollution spreads out and can affect other areas. It can be used to do a geographic analysis of different scenarios and help look at policies from an environmental justice perspective (at a county level, at least). Below is a map showing the total health benefits of our scenario.
How Good Is It?
So how good are AVERT and COBRA? Ultimately, while they have limitations, they can estimate non-energy impact values that are hard to estimate and well-vetted. Although results are shown at a county level and are based on hourly emissions, the emissions data is based on regional generation portfolios. This means that if the area of study has a very different generation makeup than other areas in the region, the estimate may not be as accurate.
COBRA is based on the changes in health outcomes related to changes in air quality. These functions are all documented and based on peer-reviewed studies, and COBRA is updated every 2-3 years. But the epidemiological studies used to estimate the adverse health effects of PM2.5 are surprisingly sparse and not very recent. For example, only three studies were used to estimate the number of emergency room visits due to asthma from 2005, 2010, and 2012. The work loss days estimate is based on a single study from 1987. The way pollutants affect the body probably hasn’t changed since then, but I speculate that treatments and job types might have.
Overall, the more research on the impacts of demand-side management and clean energy, like the USC EV study, the better.
[1] The team controlled for general improvements in air quality, which has improved over time in California due to its strict air quality rules.
[2] The EPA has another tool, called BenMAP, to estimate health impacts. The difference between COBRA and BenMAP is that COBRA has a built-in air quality model which allows COBRA to convert changes in air pollution to changes in air quality, which requires another step in BenMAP. BenMAP can also be used to analyze health impacts at a finer geographic resolution and outside of the US, can forecast out to 2050 (instead of 2016, 2023, and 2028), and can analyze ozone as well as PM2.5. But beyond that, they both use the same approach and same concentration-response functions and economic valuation forecasts.
[3] Massachusetts is technically a commonwealth.
[4] These results may seem modest until it affects someone you care for.