
Like many, I was transfixed in late March by the huge container ship stuck in the Suez Canal. And also, like many, I enjoyed the many versions of the meme of a “little” excavator trying its best to free the enormous ship but making minimal progress. As often happens, my thoughts went to the massive problem of climate change and the seeming futility of our efforts in the energy efficiency industry to make a meaningful dent in the CO2 emissions. As an individual or even someone who may have a minuscule impact on energy efficiency programs, what can I do in the face of such an insurmountable challenge?[1]
But wait, are our efforts futile? Well, it depends on how you look at the data. By some metrics, we are doing great. According to the EPA, CO2 emissions in the US have essentially flattened over the past decade, decreasing 9% from 2008 (5,931 million metric tons) to 2018 (5,425 million metric tons).[2] At the same time, the CO2 avoided as a result of electric company-funded energy efficiency and demand response programs has increased 157% (from 58 million metric tons to 149 million metric tons)! [3] This sounds great until you remember that the effects of carbon emissions are cumulative and then that time period looks like this:
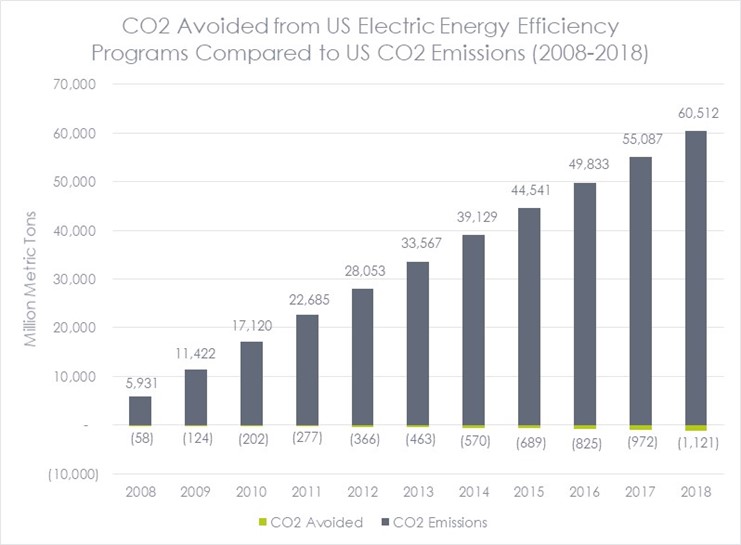
Sources: Institute for Electric Innovation, EPA
Or maybe if you prefer memes to bar charts, it looks something like this:
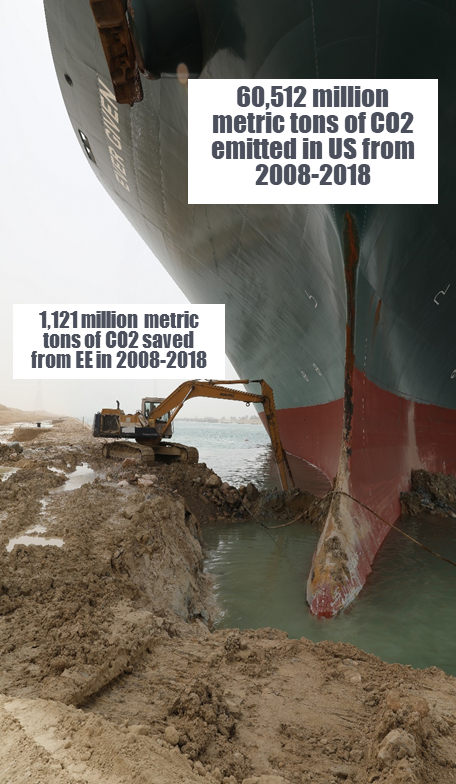
Original Photo Source: Suez Canal Authority
Seeing this information summarized like this is shocking and, honestly, depressing. Does it really matter if I switch from my 11-year-old oil furnace to a heat pump if some fracking well leaks the equivalent amount of greenhouse gases by the time I write this sentence? Ultimately, are individuals responsible for taking actions to address climate change or is there a larger corporate and/or societal responsibility to drive system-wide change?
I would argue yes, that while we desperately need to address the systemic issues, our individual actions still matter.
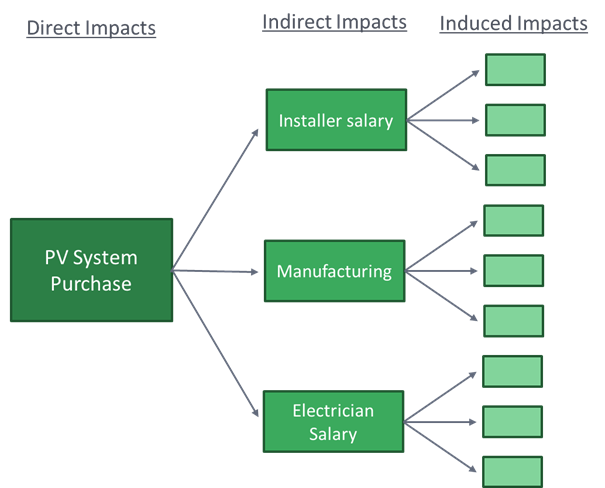
One way to think about this is similar to an economic impact analysis. The primary impact of energy efficiency programs is energy savings and related carbon emissions. But energy efficiency programs and portfolios can also be measured in other ways, such as their economic impact. Evaluators can measure the economic impact of a program using an input-output (I-O) model, which treats an economy as a set of linked economic sectors that are codependent. Because the sectors are linked, cascading effects occur from individual events, such as providing an incentive for energy-efficient equipment. The figure below provides an example of how an incentive for the installation of solar panels on a residential customer’s roof flows through the economy in the form of direct, indirect, and induced impacts. For example, a program participant may purchase solar panels, but this cost pays for salaries for the PV installer, the electrician, and the manufacturing and distribution. An employee of the PV installer (for example) then uses their increased income resulting from the utility program to purchase a new bike, which stimulates business at the local bike shop. This means that a dollar spent on an energy efficiency program results in more in a dollar of net economic benefit even in the first year and much more in future years as bill savings continue to accrue over the life of the measure.[4]
Outside of economic analyses, the idea of cascading impacts can help us understand how our actions can have far-reaching impacts. For example, consider someone who installs a cold climate heat pump in their home and then shows it off to their neighbor, their sister-in-law, and their houseguest, all of whom assumed that heat pumps were not considered reliable in their climate zone. Now, having seen a unit working well for a trusted acquaintance, these people are more likely to install a heat pump when their heating system needs replacement and/or to mention it to their friends. Or consider assuming that electric vehicles were rare, but then seeing one at your child’s daycare center, then at the bagel shop, and then again in your office parking lot, and wondering if maybe you should get one too.
This effect is not just theoretical. As an example, research in Connecticut found that residential solar PV systems in the state tended to be installed in clusters not related to income or population density. The study found a strong relationship between the adoption of solar and the number of nearby recent installations. In other words, when people saw their neighbors installing PV systems, they were more likely to install a system on their home.
Going back to the question of whether individual actions matter in mitigating climate change: it seems that our actions (e.g., replacing that furnace with a heat pump, installing PV panels on your roof) may be modest when compared to the size of the climate problem at hand, but they can have a supersized impact because they send a message to others. If our actions lead to others taking actions and that leads to still others taking actions, these cascading effects can add up to make significant impacts. This may even influence organizations or governments to modify their behavior, which prompts additional, even systemic, change.
Measuring Savings Outside of Programs
Ok, that all sounds great. But how do we evaluate and measure all these cascading effects?
First, programs often claim some additional savings through spillover. I will dive more deeply into spillover in a future post but, at a high level, spillover is the savings caused by the presence of demand-side management programs beyond those directly associated with program participation. Spillover can be divided into participant spillover, in which a program participant, influenced by the program, implements energy-efficient measures outside of the program (either at the same site or different sites and either the same type of measure or different measures) and nonparticipant spillover, in which a nonparticipant implements energy-efficient measures that are influenced by the program but are not accounted for in program savings.
Program interventions can also lead to market effects (spillover savings that reflect meaningful changes in the structure or functioning of energy efficiency markets) or market transformation (market effects that are substantial and long-lasting). One issue with spillover research is that it primarily focuses on spillover that is perceived by the end-user and may not include broader market effects that they are not well-positioned to observe, like the changes in a distributor’s stocking practices. While market effects and market transformation are related to spillover, they must be measured differently due to their broader scope.
Recognizing the limited reach of typical resource acquisition programs that target individual customers, many program administrators have begun to shift to market transformation initiatives. According to the Midwest Market Transformation Collaborative, market transformation is the “strategic process of intervening in a market to create lasting change that results in the accelerated adoption of energy-efficient products, services, and practices.”
Market transformation initiatives differ from typical energy efficiency programs in several ways. A key aspect of market transformation initiatives is that, because they are attempting to measure the change in a market, they need to start from an initial baseline and should not be backward-looking trying to claim credit for past actions. As such, they need to have a documented theory of change, often illustrated in a program theory/logic model. This allows for the program (and evaluators) to understand and measure the linkages between program activities and market change. Because the target is a market and not a single transaction, evaluators must look at multiple indicators to measure change and to understand if the program is influential. Importantly, this needs to be set up from the start of the initiative so that changes can be compared to a baseline over time. Examples of market progress indicators include the market availability of certain types of equipment/services, the promotion of equipment/services by contractors, and the level of different applicable barriers. Evaluators should conduct regular research to understand the changes to the market and measure market progress indicators.
If energy efficiency is going to substantially decrease the level of CO2 emissions, program administrators and evaluators will need to move on from focusing on individual actions (i.e., rebates for widgets) to looking at how to harness broader market transformation. This will require accounting for the influence we each have on others and how good ideas can spread through cascading effects to add up to big changes.
[1] Note that this blog may start down a dark road, but it will get to a positive place, I promise.
[2] https://cfpub.epa.gov/ghgdata/inventoryexplorer/#allsectors/allgas/gas/all
[3] https://www.edisonfoundation.net/-/media/Files/IEI/publications/IEI_Energy-Efficiency-Report_Mar2020.ashx
[4] The exact level of economic impact varies by program and jurisdiction due to differences in inputs such as bill surcharges, program spending, incentive levels, implementation design (e.g., incentives vs. contractor rebates vs. direct install), and measure mix (e.g., weatherization programs create more local economic activity among contractors while lighting programs create more economic activity among equipment manufacturers which are likely outside of the utility’s service territory).